SafteyGibberellic acid may cause irritation of skin and eyes. Wear eye protection and avoid skin contact. Wash your hands after use. 3% sodium hypochlorite solution (bleach) is an irritant. Wear eye protection. Use in a well-ventilated space. The incubated agar plates are a potential biohazard, though a hazard is unlikely with _ starch agar. Practise good aseptic technique and do not completely remove lids. Wash hands after handling. Sharp scalpels may cause cuts. Hold seeds in forceps when cutting. Equipment
Independant VariableConcentration of gibberellin in ugdm -3 Dependant VariableDiameter of clear area around cereal grain where there is no starch Control Variables
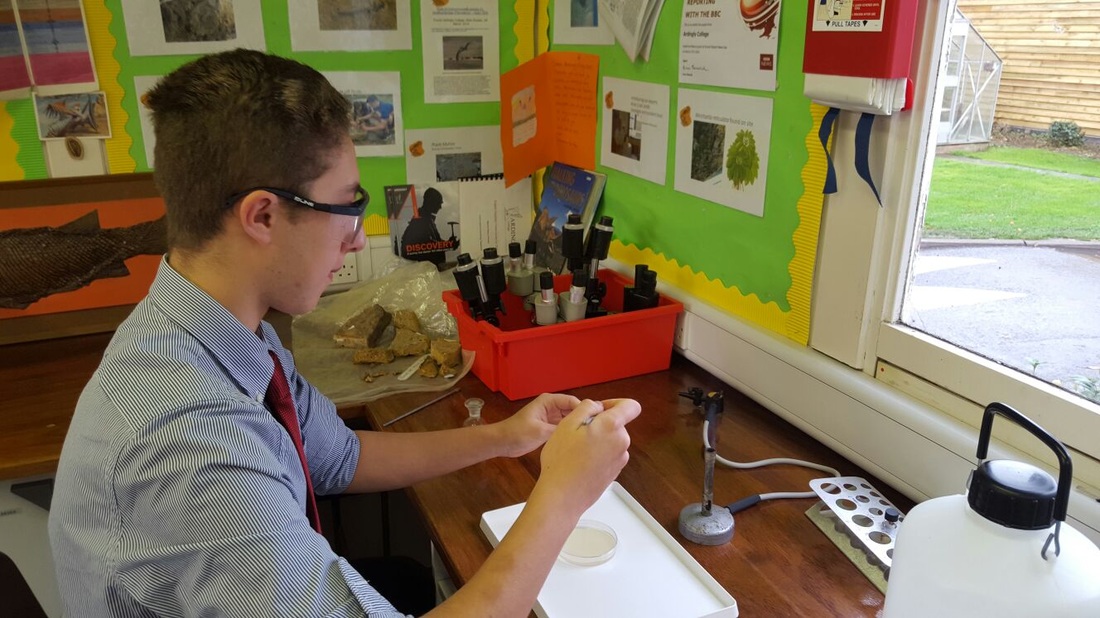
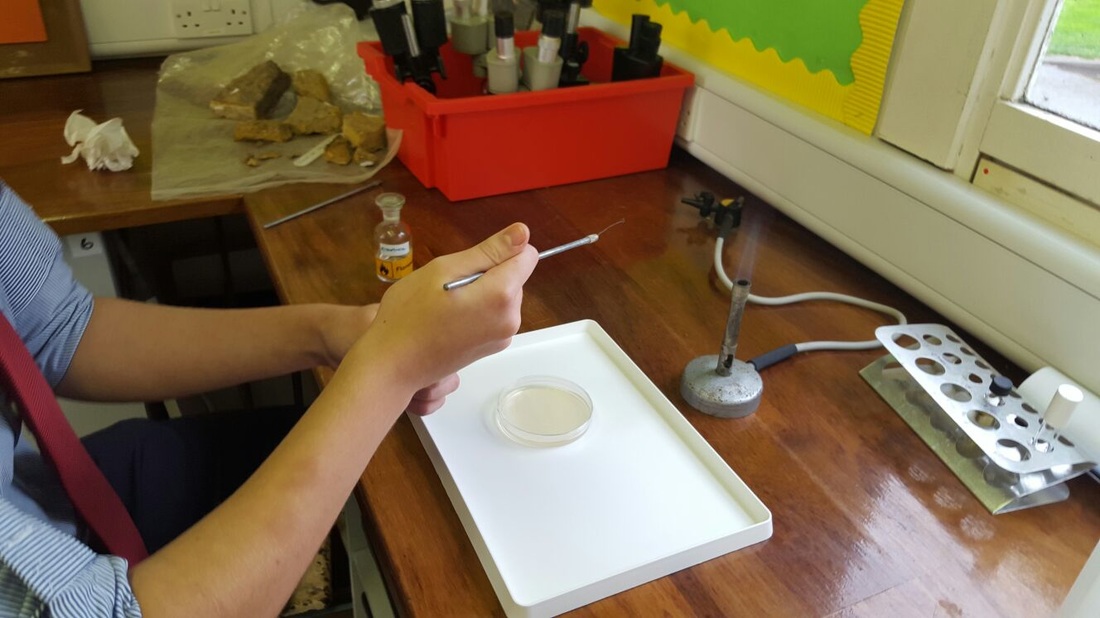
ProcedureA cereal grain contains a store of starch within the endosperm. During germination the starch must be made soluble so that it can be transported to the embryo to support the growth of the seedling. The embryo is much smaller than the endosperm and is situated at the more pointed end of the grain. The developing embryo releases gibberellins that act on a layer of cells on the outside of the endosperm, stimulating these cells to release the starch-digesting enzyme amylase. In this activity you will remove the embryo and investigate the effect of different concentrations of gibberellin on the production of amylase. The production of amylase will be assessed by using a starch agar assay. Cereal grains that have had the embryo removed are first soaked in gibberellic acid, then placed onto the starch agar plates and incubated. The agar plate is then flooded with iodine solution, which stains starch blue-black. The areas where starch has been digested will not stain. The size of the clear area around a cereal grain indicates the amount of amylase produced by the seed. Planning The basic procedure is outlined below but you will need to produce a plan before you start. This should provide detail and justify your decisions on how you will do the following. Set the levels of the independent variable (gibberellin concentration). We will use a range of 6 different concentrations from 0 ugdm-3 to 500 ugdm-3. We are using intervals of 100 umgdm-3. 0cugdm-3 is our control variable to allow us yo compare what effect having no gibberellin has on an endosperm Measure the dependent variable (size of the clear area). Finally we need to ensure that we control any other factors that we are not measuring. This means that gibberellin concentration is the only variable that we are measuring making our experiment valid. It is important that a good sterile technique is used throughout this investigation to prevent the growth of microorganisms that could present a biohazard. Day 1 1. Make up your gibberellin solutions as planned. Only small volumes (a few cm3) of each are required. Place each solution in a small labelled sample bottle. 2. Collect the number of seeds that you require and pull any husks off the grains so the shape can be seen clearly. 3. Cut each seed across the line X-Y (see fig A) so that one half contains the embryo and the other the endosperm. Keep the two halves separate and discard the seed halves that contain the embryo. 4. Sterilise the remaining endosperm halves of the seeds by placing them in 3% sodium hypochlorite solution for 5 minutes. 5. Wash the seeds thoroughly, but quickly. through have changes of sterile water, draining carefully through muslin each time, until there is no smell of chlorine. Drain fully. Secondary ResearchFrom looking at secondary research I have learnt that gibberellin acts as a transcription factor in the cereal grains. The gibberellin binds to the DNA at the promoter sequences at the points where it transcribes for the code that produces the proteins that make up the enzyme amylase. The research was carrried out be Sang-Choo Lee and his team in the University of Seoul. http://www.sciencedirect.com/science/article/pii/S0176161717301062
11 Comments
A journal published online on October 8th 2015 in the Journal of the American Medical Association has suggested that the low rates of cancer seen in elephants can be explained by the multiple copies of the cancer suppressor gene, TP53. The theory is that because of the elephants size, it has 100 times as many cells as a person. Therefore, elephants should be 100 times more likely to have the disease. However analysis, published on the Journal of the American Medical Association, showed only 4.8% of elephants die from cancer compared to up to 25% of people. Humans have one copy of TP53 from each parent, and both are needed to prevent cancer development. In contrast, elephants get at least 20 copies of TP53 from each parent. To confirm the effectiveness of the cancer suppressor gene, the study compared 21 human and 8 elephant candidates. This were made up of 2 African elephants, 6 Asian elephants, 10 people with whats know as Li-Fraumeni syndrome and 11 people without. Li-Fraumeni syndrome is the monosomy of this TP53 gene. As a part of the experiment, their red blood cells were exposed to radiation. If a healthy cell is exposed to radiation, TP53 triggers apoptosis of the cell, killing it. This protective mechanism prevents cells likely to develop cancer from spreading throughout the body. As expected people with Li-Fraumeni syndrome had the least cell suicide with just 2.7 percent of their blood cells that died. In the healthy humans, 7.2 percent of the cells died, but in the elephants, 14.6 percent of the cells died, the researchers found. This relates the what we learned in class as TP53 is an example of a "loss of function gene" that can be produced during the G1 checkpoint in interphase. This can either cause the cell to be completely destroyed or slow the cell cycle down to try and resolve the problem. References: http://www.medscape.com/viewarticle/852363 http://www.bbc.co.uk/news/health-34466220 http://www.livescience.com/52432-elephants-cancer-resistance.html 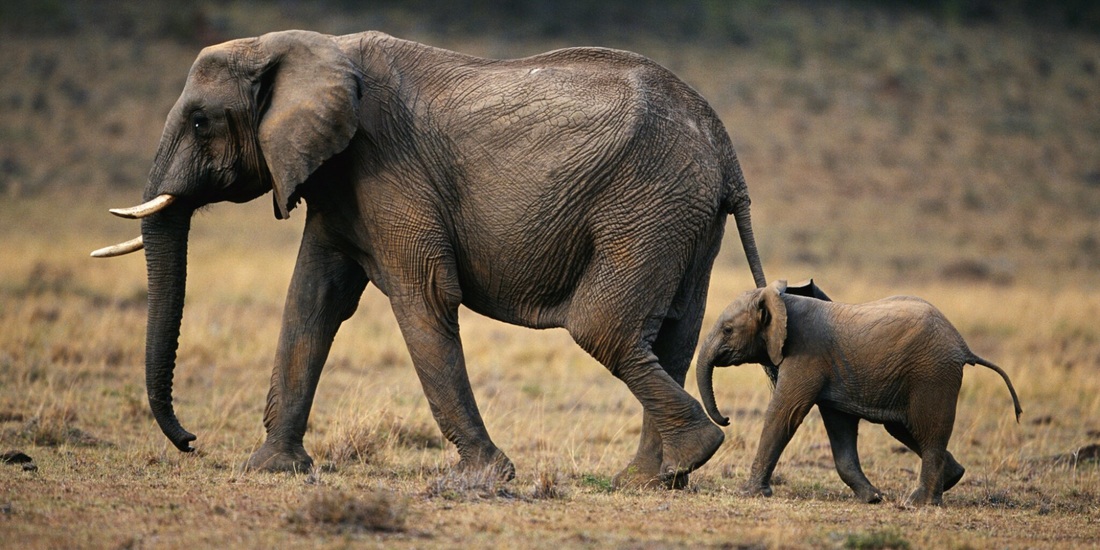 A flowchart to demonstrate the process of peer review 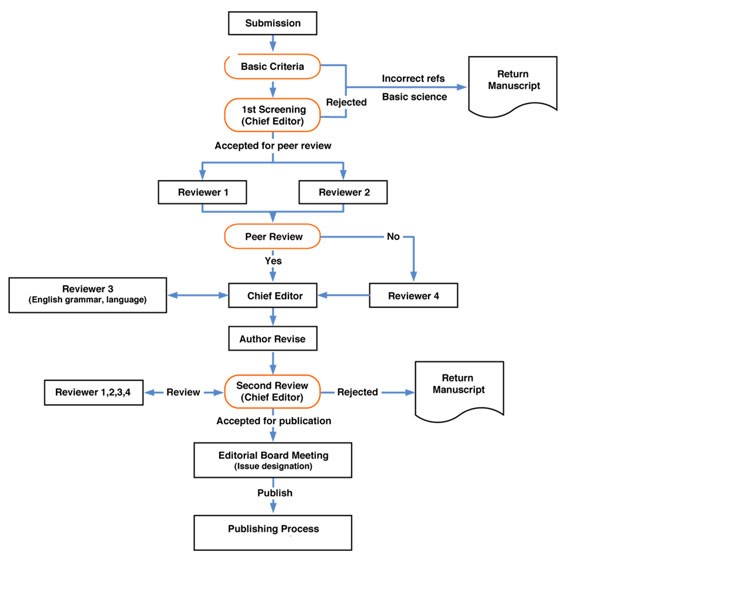 Method
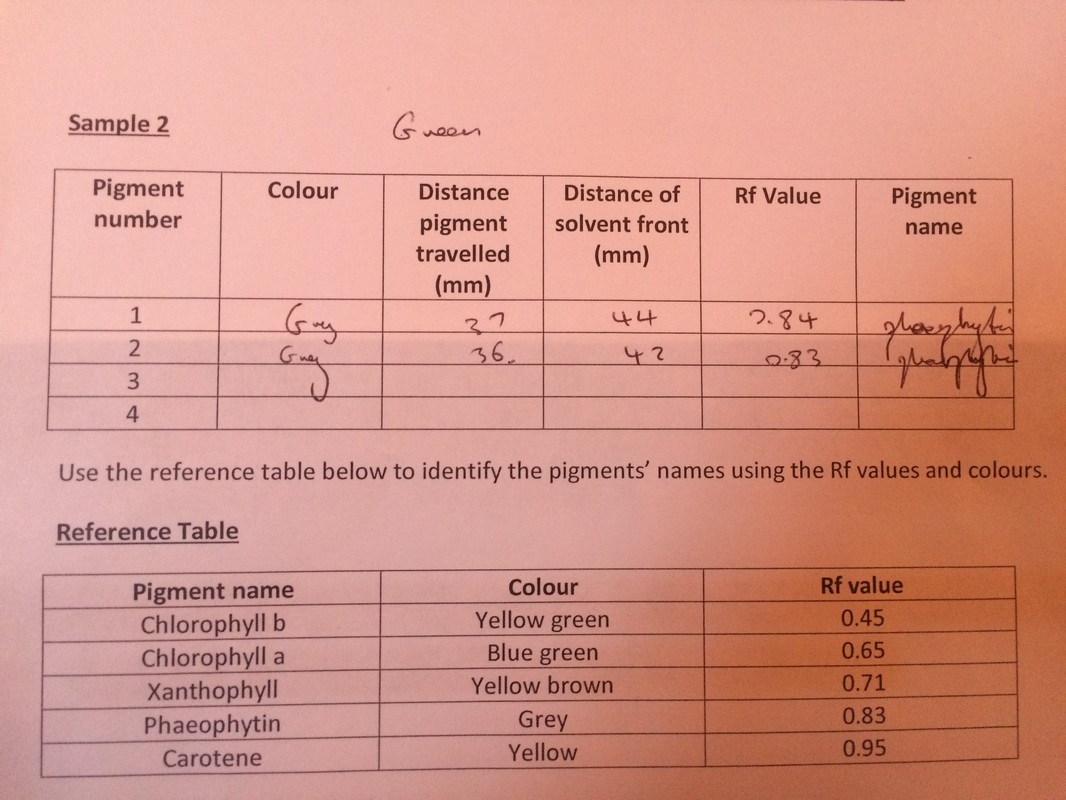
Results
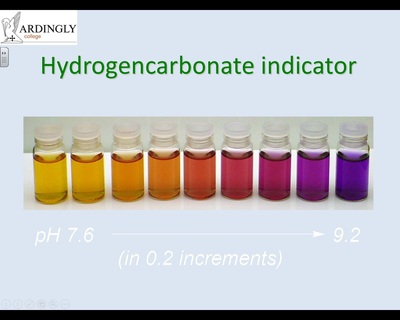
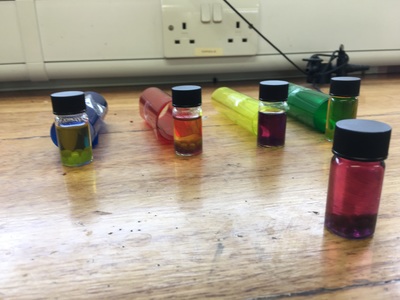
The picture taken shows examples of the colours produced by the pH hydrogen carbonate indicator, compared to some standard hydrogen carbonate solutions. The vial that was without a coloured filter turned a deep purple colour. From the pH scale this shows the pH in that vial was at roughly 8, meaning it is in an alkali solution. This is because all wavelengths of light were able to penetrate the vial so that the algae in the vial could photosynthesise at its greatest rate. Therefore the production of CO2 in the vial was at its greatest leading to the greatest colour change. However the vial which had the green filter on, the colour has stayed yellow suggesting a pH of around 7. This is because that the green filter prevented all wavelengths of light other than green from penetrating the vial. Therefore the lowest light intensity is being absorbed by the plant so the least amount of photosynthesis is occurring. So the lowest concentration of CO2 is being produced.  From the graph above we can see that green spectrum (around 520-550 nm) and since the alga cannot photosynthesis. This explains why the algal balls in this spectrum didn't produce much CO2.
Equipment
SafetyBecause soda lime is very corrosive, eye protection must be worn at all times during the experiment. A spatula should also be used to remove the soda lime from the container. Maggots can also carry pathogens on their skin so you should wash your hands carefully after handling them. Method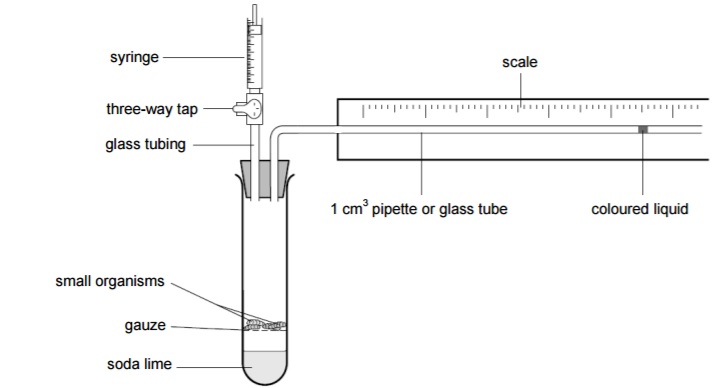
Results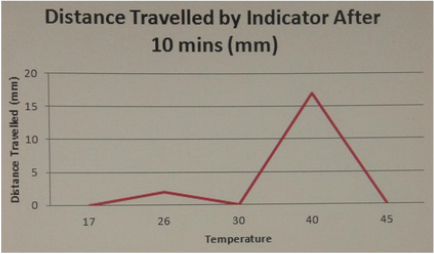 From the results there is an optimal temperature for the rate of aerobic respiration at 40 degrees. This shows that respiration is an enzyme controlled reaction meaning that the rate of respiration is very slow at low temperatures and at temperatures above 40 degrees the active site becomes denatured which halts respiration since the substrate is unable to bind with as there is no induced fit. At the lower temperatures where a little respiration still occurs, there isn't enough energy for the substrate molecule bind to the active site. Therefore the rate is very slow. Secondary ResearchFrom secondary research I have learnt that the increase in respiration is due to the increase in metabolic rate as a result of the increased kitentic energy, allowing reactions to happen at a greater rate as collisions between molecules will happen more frequently so there's a higher chance that the collide with sufficient kinetic energy and at the correct orientation. I also learnt that te size of the organism also has a large affect on the rate of respiration so it is important to control that when considering how to keep my experiment valid. I did this by carefully selecting maggots of a similar size.
http://science.sciencemag.org/content/293/5538/2248 To investigate whether periwinkles show a preference to different environments on a rocky shore.7/9/2016 Aim
Method
Results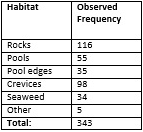 Method for Observing variety
Results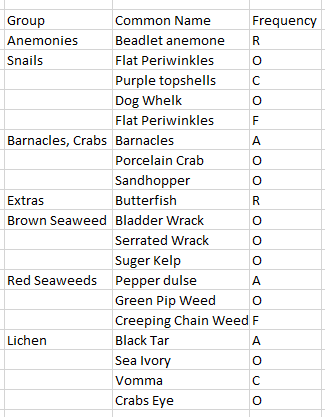 Apparatus
Method
 Equipment
Method
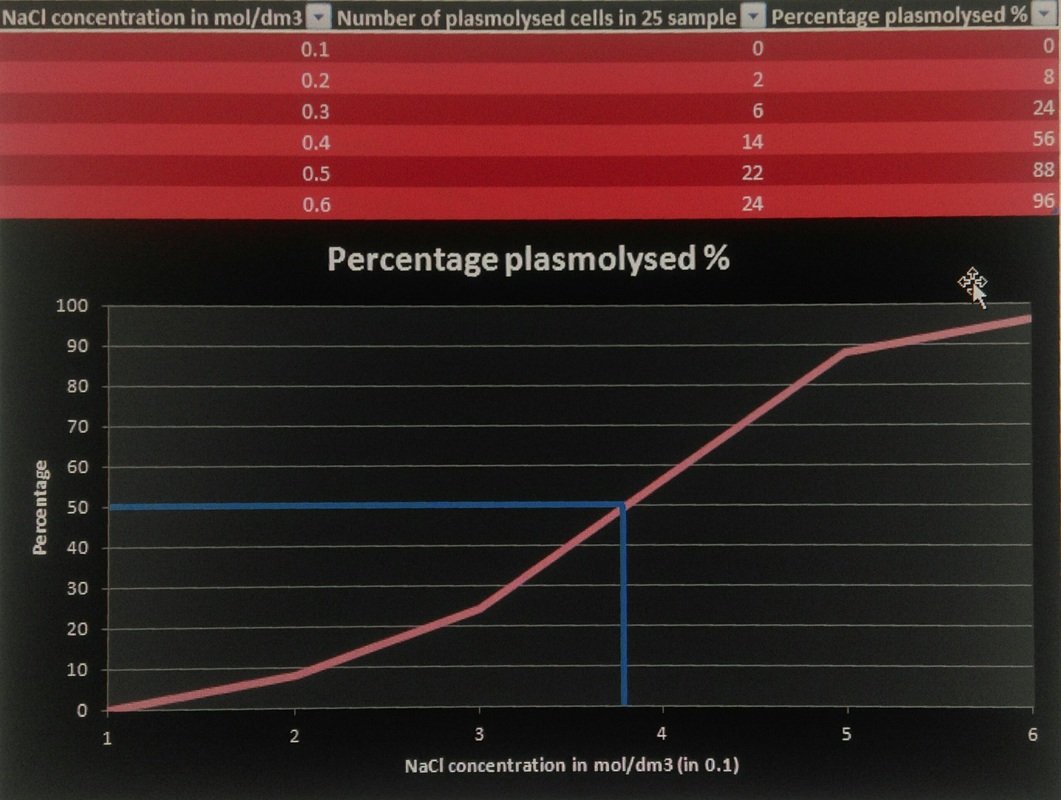
Results We found that the slides that had been placed in weaker solutions had a greater number of cells that remained unchanged and the cytoplasm did not come away from the cell wall. This is because there is a higher concentration of water outside the cell and since water moves down the concentration gradient through diffusion into the cell, it remains turgid. However, the cells on the slide containing a more concentrated solution have a higher concentration of water in the cell than outside. As a result the water diffuses down the concentration gradient so water leaves the cell through osmosis causing it to become flaccid and the cytoplasm peels away from the cell wall. This is a cell that has undergone plasmolysis. We can tell which solution is isotonic by when the cells suspended in the solution are in incipient plasmolysis. This is when the cytoplasm is just about to pull away from the cell wall. However, because this is very hard to see, we can tell the this is happening when 50% of the cells have plasmolysed. As we can see from the graph the solution is isotonic to the cell at 0.375 mol/dm3 because that is where 50% of the cells have plasmolysed. The first records of the ivory trade go back as early as the 14th century. Raw ivory was first used for piano keys, billiard balls and other items that show high wealth. Slaves were often used to transport tusk through colonised areas of Africa.
As the number of elephants dying of natural causes decreased, Ivory hunters were now beginning to use illegal poaching methods to meet the demands. Illegal hunting was responsible for wiping out elephants in North Africa perhaps about 1,000 AD, South Africa in the 19th century and West Africa by the end of the 20th century. 800 to 1,000 tonnes of ivory was sent to Europe alone at its peak of 20th century. After the First and Second World Wars, there was a decline in the amount of trade because economic depressions meant that people could not afford the luxury commodity. However as the economy improved into the late 1900s there was a surge in the amount of ivory traded. In Japan, after exchange restrictions were lifted after World War II, there was a large rise in the ivory trade. Hard ivory was preferred by the Japanese for the production of hankos (stamps), or medicine. Softer ivory from East Africa and Southern Africa was traded for souvenirs, jewelry and trinkets. By the 1970s, Japan consumed about 40% of the global trade. Aim
Safety
Equipment
Diagram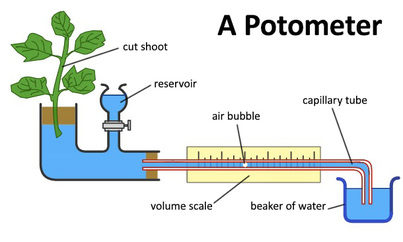 Procedure
Results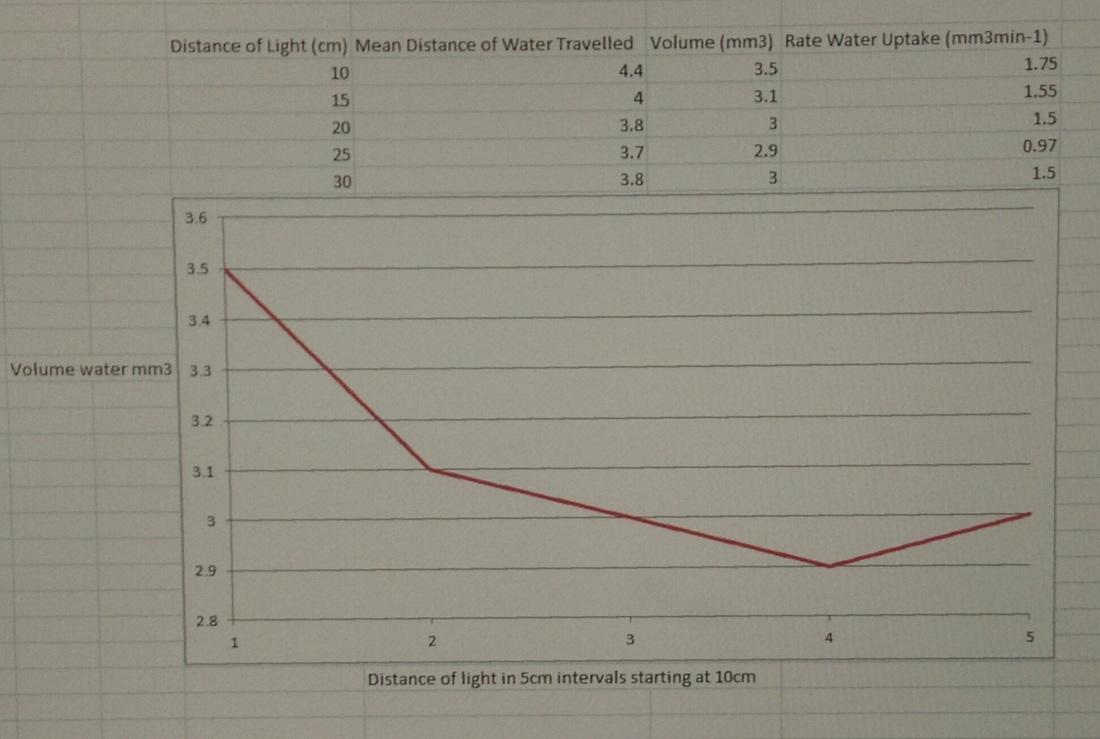 AimMy aim is to see how the permeability of beetroot membranes are affected by a change in temperature. Equipment
Method
SafetyThe water baths above 50 degrees are hot and therefore can burn so you must be careful when handling them. When using the scalpel to cut the beetroot, you must be careful not to cut your hand. Results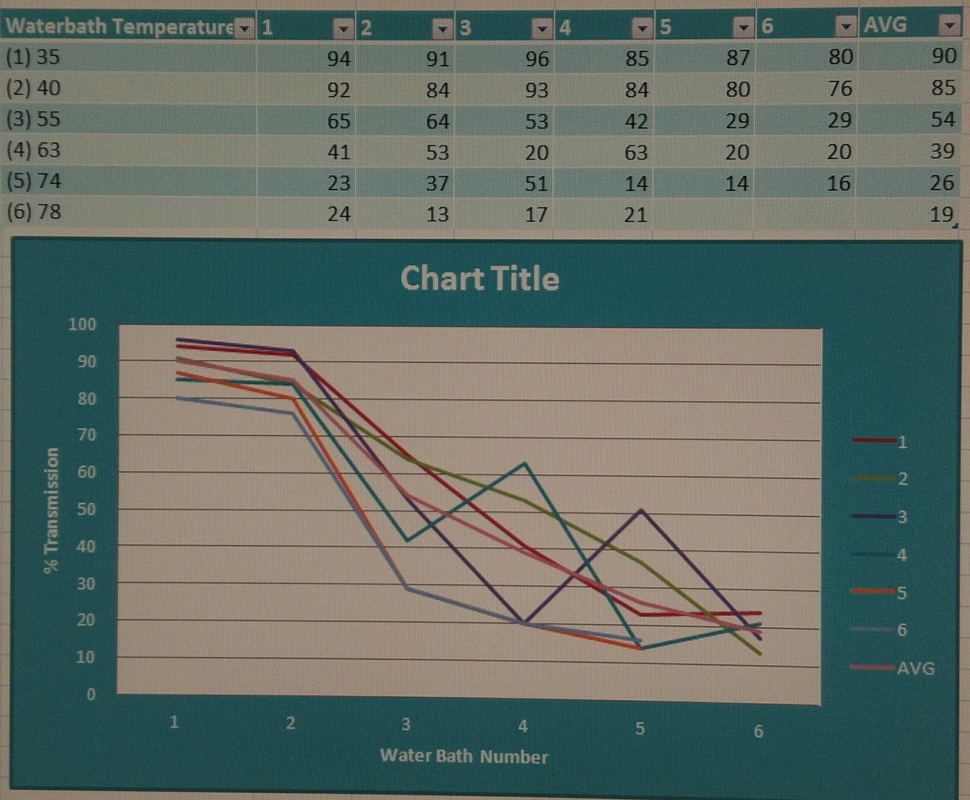 QuestionList the variables that were controlled during the experiment and state how they were controlled.
Shape and size of beetroot samples can be controlled by using a ruler to perfectly get 1cm samples. Also it is important to cut straight down and not at an angle so the surface area is not changed. The cork bore also produces perfect cylinders. Time left in water bath - were left in bath for 15 minutes, this was measured with a stopwatch Suggest why the tubes were placed in the water baths for 5 minutes before the cylinders were added This was to allow the water in the test tubes to reach the same temperature as in the water bath Why were the beetroot cylinders washed with distilled water and dried before the experiment This was to remove pigment that has come out from the beetroot in the process of extracting cylinders and cutting into 1cm lengths. Use the trend line of your graph to describe the effect of temperature on the percentage transmission between 30°C and 80°C Explain your results in detail in terms of what is happening to the beetroot membrane My class and I found a negative correlation between temperature and transmission, meaning as the temperature rose, less light was able to pass through the solution. This is because at higher temperatures, the phospholipid membrane becomes more fluid and 'leakier', meaning more pigment is able to escape. It also means that the proteins in the membrane denature and allow more pigment to pass through. Aim I aim to examine gill filament under a microscope by dissecting a fish head to help me understand more about the gas exchange system of fish. Equipment
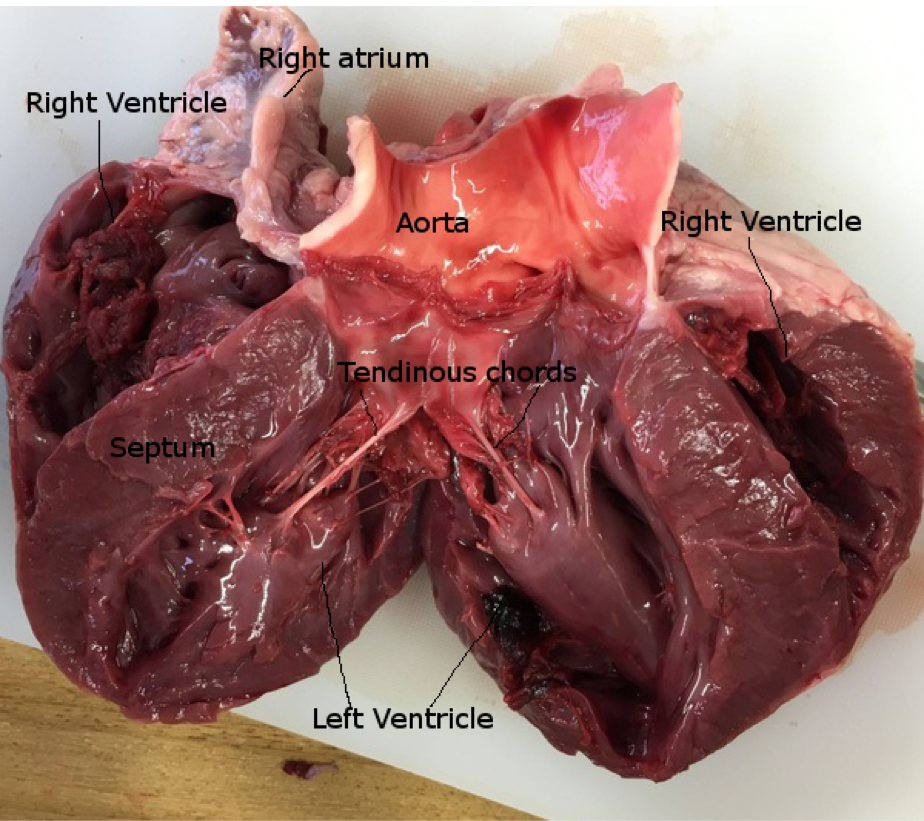
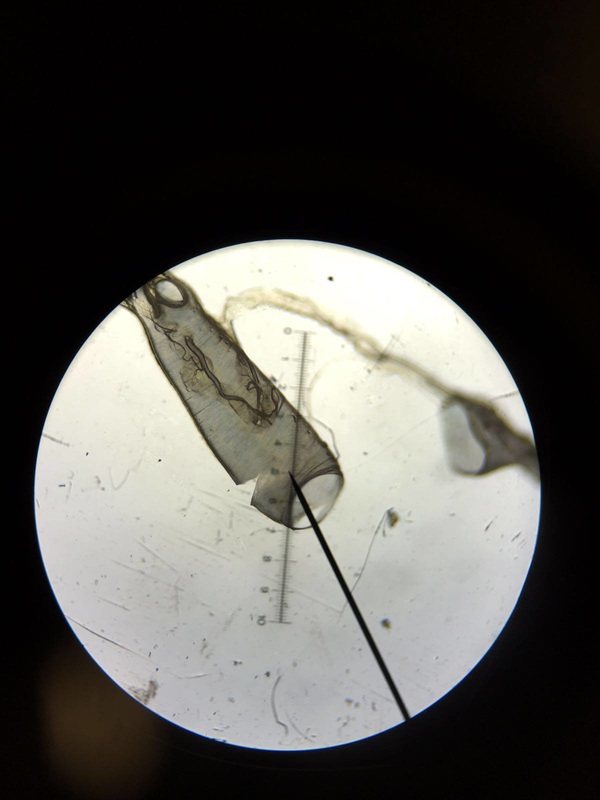
Oxygen is absorbed by a fish in a system known as countercurrent. This means that even as the blood reaches the end of the filament and is 80% or so saturated with oxygen, it is flowing past water which is at the beginning of the filament and is 90 or 100% saturated. So, even when the blood is highly saturated, having flowed past most of the length of the filament, there is still a concentration gradient and it can continue to absorb oxygen from the water.
AimThe aim of this investigation is to see how the surface area to volume ratio affects the rate of diffusion of agar in HCL solution. Equipment
SafetyHydrocholric acid is an irritant so eye protection has to be worn. Importance must also be taken when using the sharp blade. Method
Result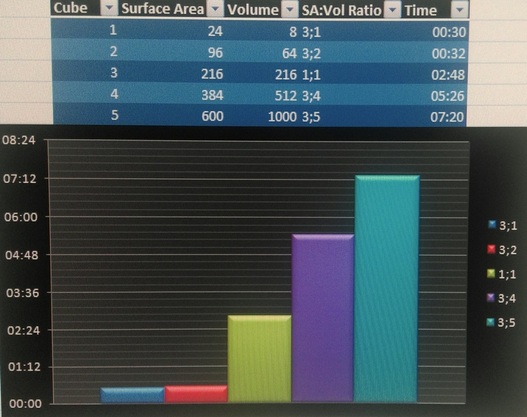 The y axis is time The x axis is the SA:Vol ratio AnalysisWe can see from the graph that as the difference in the surface area:volume ratio increased the time taken for the hydrochloric acid to diffuse through the cube also increased showing a positive correlation. As we can see from the graph when the surface area is greater than the volume e.g. in the 3:1 cube, it only took 30 seconds. This is compared to the 3:5 cube which has a larger volume than surface area causing it to take 7 minutes 20 seconds for the HCL to diffuse. This is because although there is a greater distance to the centre of the cube for the HCl to travel, and less points of contact for the molecules to collide, creating the diffusion.Therefore the higher the SA : Vol Ratio the quicker the diffusion throughout the cube. Factors That Must Remain ConstantTemperature
Shape of block Size of block Immersion method Volume of acid used Concentration of acid Type of agar Carnitine is an amino acid and nutrient which metabolise lipids by transporting them to mitochondria. This exists naturally in red meat and unnaturally in energy drinks. By studying how carnitine affects our body we can begin to explain why eating lots of meat increases the risk of heart disease.
Stanley Hazen at the Cleveland Clinic Lerner Research Institute in Ohio and colleagues gave large doses of carnitine to mice. The team found that this increased the incidence of atherosclerosis. Bacteria in the intestine use carnitine as an energy source, breaking it down and producing a waste product called trimethylamine (TMA). The liver converts this into another substance, trimethylamine-N-oxide (TMAO), which is excreted in urine. TMAO increases the uptake of “bad” cholesterol and prevents its destruction by macrophages white blood cells in artery walls. This causes a build-up of plaque that can lead to atherosclerosis. References: http://www.lerner.ccf.org/cmm/hazen/ https://www.newscientist.com/article/dn23352-red-meat-boosts-gut-bugs-that-raise-heart-disease-risk/ Atherosclerosis is a disease where arteries become narrowed by fat, cholesterol and calcium. Together this substance is known as plaque which can restrict blood flow causing damage to organs. 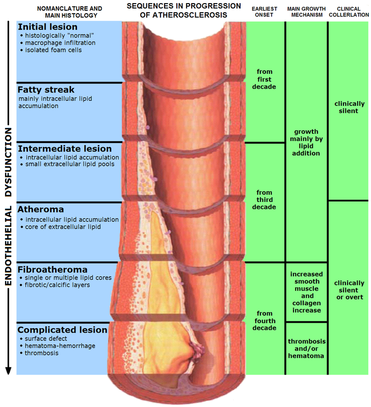 Stages of AtherosclerosisStage 1 Endothelium becomes damaged (e.g. due to risk factors such as high blood pressure, or cigarette smoke) Stage 2 This damage causes inflammatory response so white blood cells move into the artery wall, and cholesterol from the blood begins to accumulate. The built up deposit is called an atheroma. Stage 3 Calcium salts and fibrous tissue build up at site and form a hard swelling known as plaque, making the artery lose some of its elasticity causing it to narrow. Stage 4 Plaque makes it difficult for the heart to pump blood around the body and results in high blood pressure. This in turn makes it more likely that plaque will form as there is now an even greater blood pressure. Symptoms
There are also symptoms of heart attacks and strokes which can occur when the plaque ruptures sending a blood clot into the coronary arteries which provide blood to the heart and carotid arteries which supply blood to the brain. The symptoms of a heart attack are:
Risk Factors
Equipment
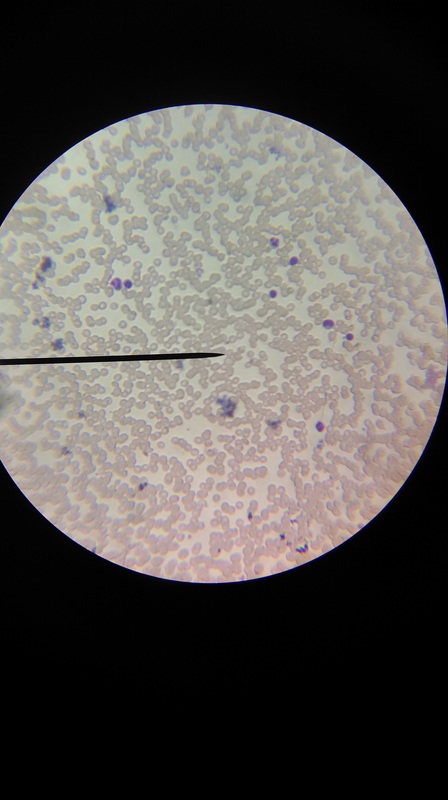
Although my blood sample was a bit too thick, by friend Toby was kind enough to share his blood. We can clearly see the large cluster of red blood cells with the darker purple dots which indicate white blood cells.
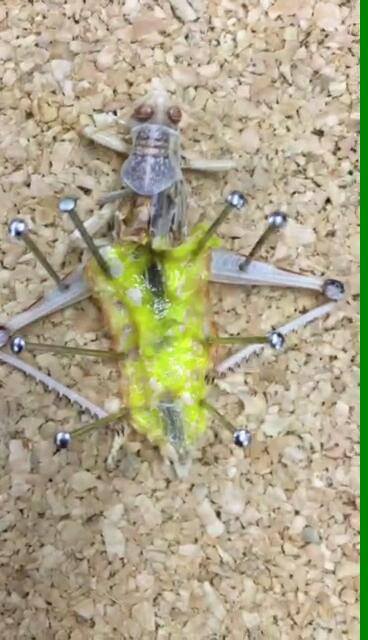
References: http://tbrann.weebly.com Aim We aim to dissect a locust in order to look more closely at the insects respiratory system to see which features it uses for gas exchange. The main organs that we aim to see are:
Resources: Edexcel A level Biology textbook As we can see this is how we prepared our dissection with the pins.
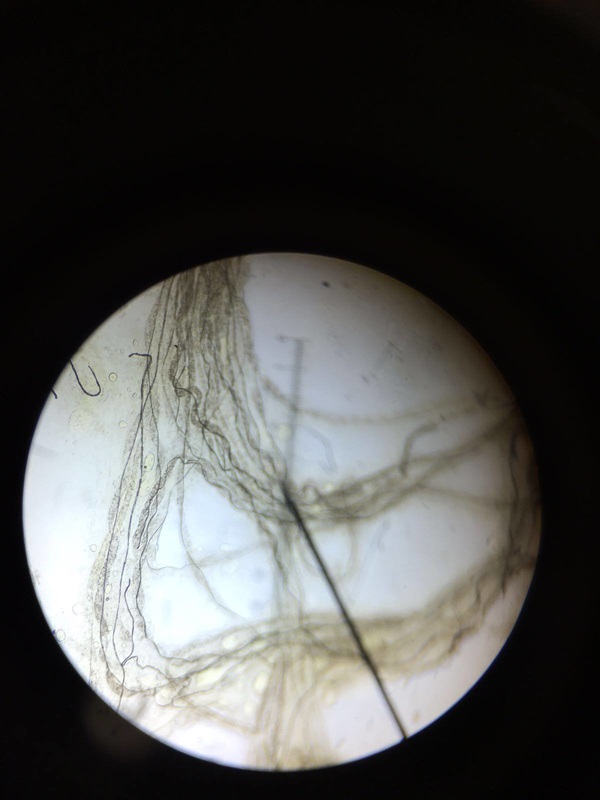
the middle photo is an example if a tracheae as when zoomed in the chitin spirals are visible. The final photo shows tracheoles which lack the spirals and is much smaller in size.  In gastropods, respiration is on of the key distinctions between the different snail groups. This allows scientists to learn how snails have adapted to living in terrestrial (land), sea or freshwater environments. Filamentous GillsGills are found in a wide range of snails, including marine, freshwater, and even terrestrial forms. Examples include periwinkles, conches, and whelks. The gills look bird's feather, with narrow filaments coming from either side of a stalk. The water enters the gills through respiratory pores on both side known as The water current to supply these gills is evacuated through a slit or notch in the upper surface of the shell, below which the anus opens. 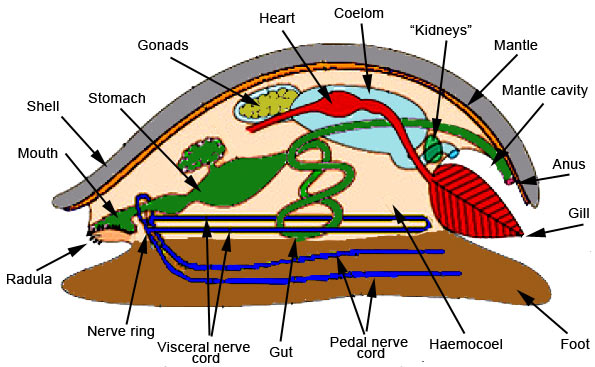 PulmonatesThe pulmonates are gastropods that have lost their gills and adapted to a direct entry into the lung. The lung has a single opening on the right side, called the pneumostome. The roof of the lung is highly vascularised, and it is through this surface that gas exchange occurs. The majority of pulmonates, however, are fully terrestrial however some under water snails have evolved to respire this way too and regularly return to the surface to respire. This form of respiration is much more similar to humans. 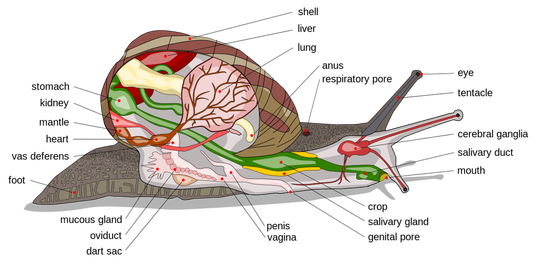 How Snails are Adapted to Their EnvironmentShells - protect them from predators and the elements. Cone snails also use cone-shaped shells to help them burrow into ocean sand. Shell patterns can also act as camouflage and its thickness helps to maintain moisture.
Slime - snails secrete mucus is an adaptation that helps terrestrial snails survive out of water. Snails' slime is naturally hygroscopic, meaning that, instead of releasing water, it attracts it. Hermaphroditic - they can change sex if necessary to procreate. Also as well as change sex, some snails can self-fertilize and reproduce asexually. References: http://www.molluscs.at/gastropoda/index.html?/gastropoda/morphology/respiration.html https://en.wikipedia.org/wiki/Respiratory_system_of_gastropods https://www.youtube.com/watch?v=FTNylZrm-x0 Method:
Results: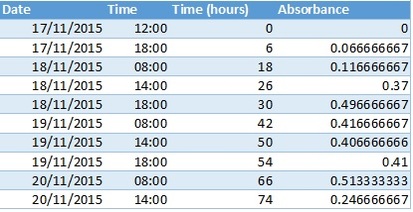 I plotted the collected results on a graph to portray a greater visual representation. This allows you to more easily track the absorbance rate to see how the population of the yeast varied. it also allows me to compare my results with an ideal growth curve of yeast cells. 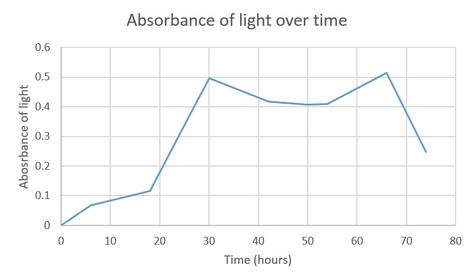 Below is an example of the ideal theoretical growth curve of a colony of yeast cells: 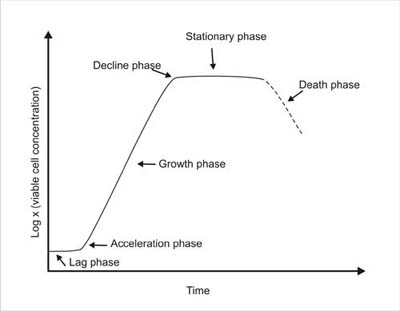 Analysis of results: Overall I think our results clearly reflect the ideal shape of the number of cells over time. Therefore, we can assume our results to be reliable and show an accurate curve of how a colony of yeast grows over time. As we can see from the graph, our culture exits the lag phase and accelerates into the exponential growth stage after 20 hours. It then begins to decline into the stationary phase after 30 hours. It remains in this stage for a further 35 hours before further declining into the death phase. As we can see however this unwanted dip during the stationary phase clearly shows a mistake in our experiment. However because it happens multiple times throughout that 35 hour period shows we made systematic errors. Lag Phase: Bacteria are becoming accustomed to the new environmental conditions that they have been introduced to for example pH, temperature, nutrients. As a result there is no significant increase in numbers with time. Exponential Growth Phase: The population can rapidly increase with time at an exponential rate as the conditions are optimal for growth and there is no competition for resources. Stationary Phase: Eventually as a lack of nutrients and build-up of metabolic by-products, the growth rate slows to a point where the growth rate equals the death rate. So there is no net growth in the bacteria population. Death Phase: The living bacteria population decreases with time, due to a lack of nutrients and toxic metabolic by-products. EvaluationOverall I feel our results almost matched our secondary source showing that we carried out our experiment under aseptic conditions. The only problem highlighted in our results was during the stationary phase. As discussed in the analysis of results it was most likely a systematic error meaning it continuously happened. I think it was a problem with our reference solution that calibrated the colorimeter. If the reference solution varied the amount of broth in that would change the readings of the absorbance rate.
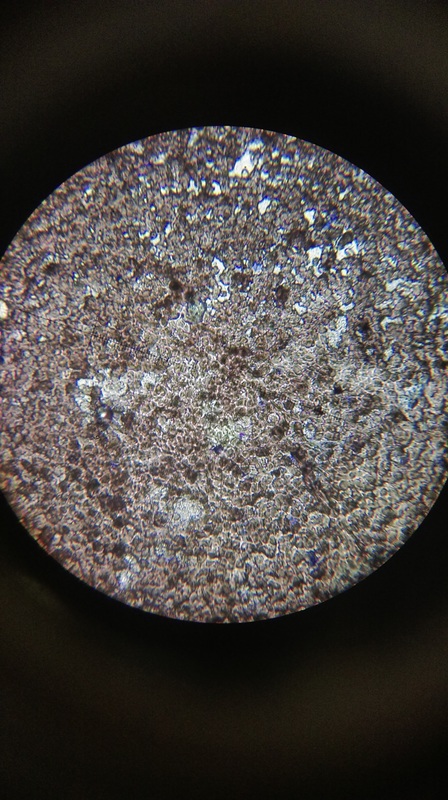
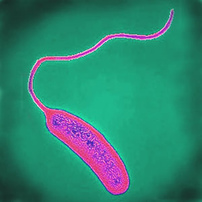 Vibrio cholerae is a Gram-negative, "comma" shaped bacterium responsible for the disease cholera. It is a facultative anaerobic organism meaning it can survive in conditions both with and without oxygen. As shown in the picture on the right, it has a flagellum at end of the cell pole. 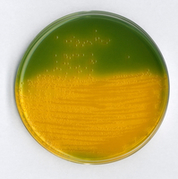 Vibrio cholerae can be isolated through the growth under certain conditions in the agar TCBS (thiosulfate-citrate-bile salts-sucrose). Sucrose is provided to maintain the metabolism of all the Gram-negative vibrios. Vibrio cholerae is uniquely isolated through the presence of an alkaline pH. In TCBS, the pH is 8.6.
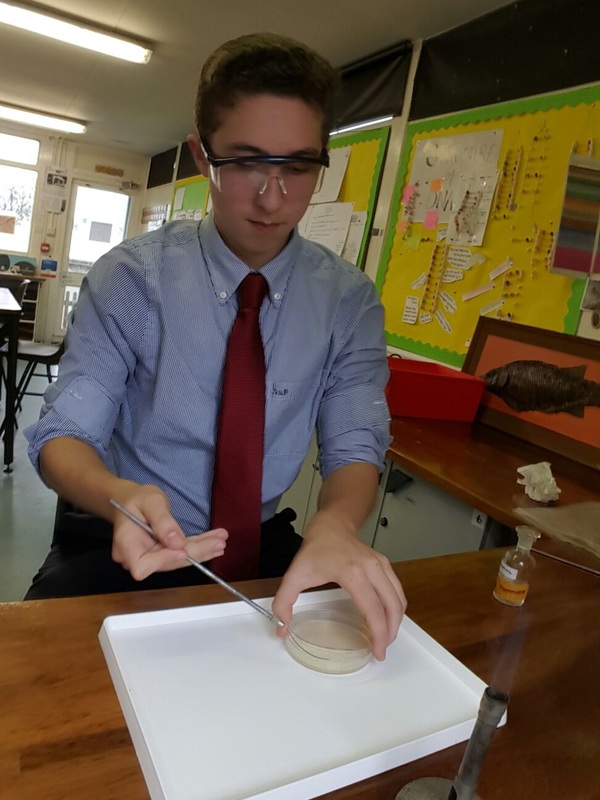
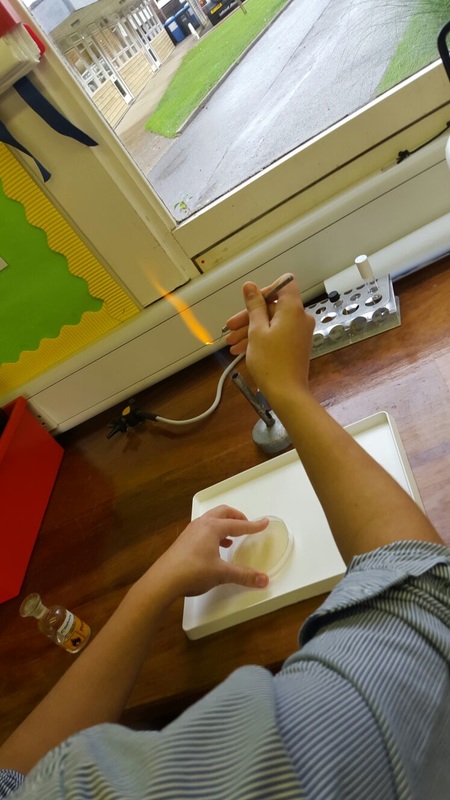
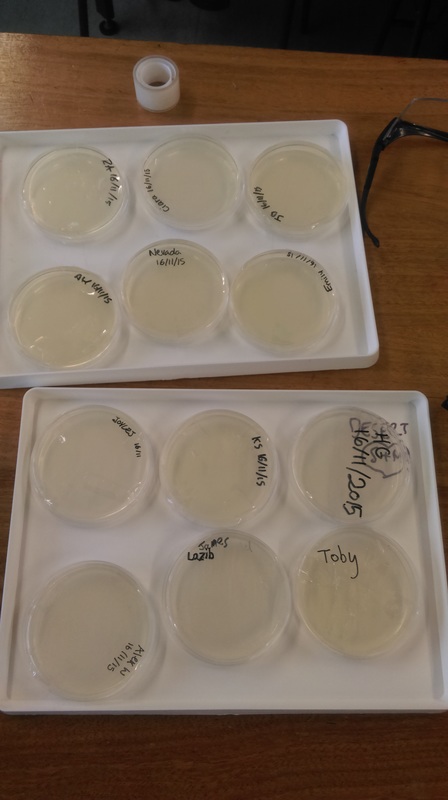
If vibrio cholerae is present, its colonies appear yellow with diameters of 1-3mm. It is important when carrying out the isolation not to confuse vibrio cholerae with Vibrio spp. which also produces yellow colonies. However this bacteria usually has maximum diameters of 0.5 mm. The sodium thiosulfate and sodium citrate found in the agar inhibits the growth of most other Gram-negative vibrios whilst other unwanted Gram-positive bacteria are inhibited by the incorporation of ox gall (mixture of bile and sodium cholate). References: http://www.ncbi.nlm.nih.gov/pmc/articles/PMC3461827/ https://en.wikipedia.org/wiki/Vibrio_cholerae In this experiment I aim to transfer a monoculture usually containing one single organism or type of organism, however ours simply contains sterile water to evaluate whether our methods of aseptic techniques were successful. I am moving it from a test tube into a nutrient agar medium whilst avoiding contamination from invading foreign organisms. The main skill for this experiment was the use of aseptic techniques with sterile equipment and procedures to prevent microbial contamination. Method First I thoroughly washed my hands to kill any bacteria I may spread by touching any instruments I used. Next, I disinfected my work station by clean it using tissue soaked in ethanol. This removes the bacteria on the surface of my work station. To sterilise my inoculation loop, I passed it through the hottest part of the blue flame until it glowed red. This is showed that all of the bacteria had been killed lowering the chances of contamination. When I opened the test tube containing the monoculture it was important the lid wasn't placed down onto an infected surface. Also to kill any diseases that could enter via the neck of the tube, it too was passed through the flame before and after the sample was taken. Finally, I covered the the agar jelly in the sampled monoculture. I did this by spreading in one direction forwards and back with intervals where I closed the lid and rotated it 90 degrees. I did this to make sure the lid wasn't off for too to prevent the contamination of any foreign bodies in the air.  Jason Chin and his team at the Medical Research Council Laboratory of Molecular Biology in Cambridge have revealed they have the technology available to hack into the genetic code of the fruit fly Drosophila and make the DNA code for the appropriate codes to make the fly bulletproof.
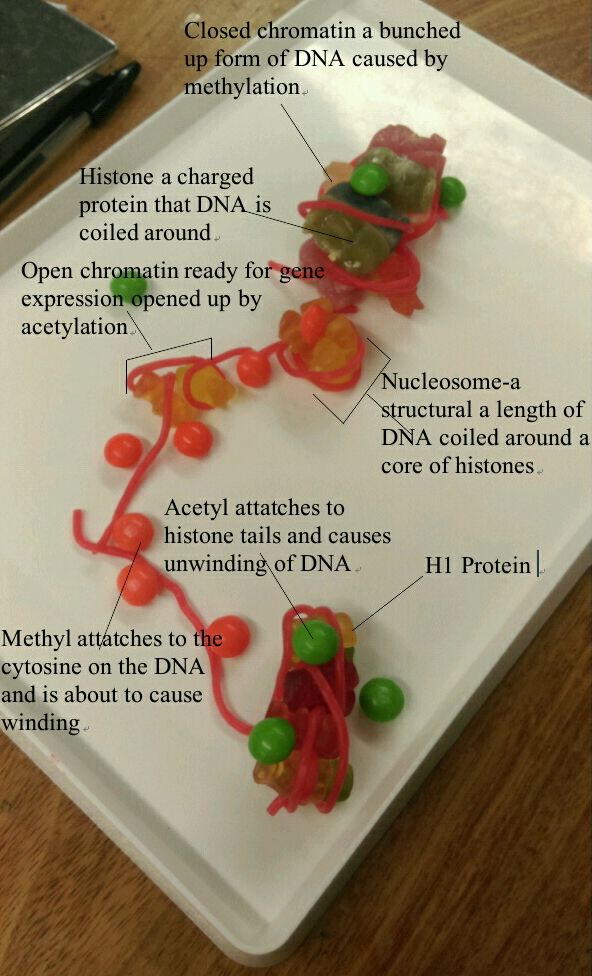
From what we learned in class the genetic code is made up of the 4 nitrogenous bases Adenine, Cytosine, Thymine and Guanine. They are read in triplets, called codons, and can be turned into proteins by the cell’s ribosomes. This is done through transcription (the process of DNA is copied into mRNA which can leave the nucleus) and translation(the process of mRNA matching with the complimentary amino acids by the tRNA in the ribosome). Each triplet code gives an instructions for a certain type of amino acid that gets added into the polypeptide chain. Some amino acids code to stop the reading of the chain and Chin showed that it was possible to replace these stop codons and incorporate an “unnatural” amino acid instead. This can then be inserted into the genome of fruit flies ovaries creating the genetically "upgraded," offspring. This will then show the phenotype of its bulletproof exoskeleton. Reference: https://www.newscientist.com/article/dn22167-synthetic-upgrade-for-fruit-flys-dna/ |